Consumer's Objectives
What do consumers want? What do they maximize?
Avoid being normative & make as few assumptions as possible
We'll assume people maximize preferences
- WTF does that mean?

Preferences I
- Which bundles of (x,y) are preferred over others?
Example:
a=(412) or b=(612)
Preferences II
- We will allow three possible answers:
Preferences II
- We will allow three possible answers:
- a≻b: Strictly prefer a over b
Preferences II
- We will allow three possible answers:
a≻b: Strictly prefer a over b
a≺b: Strictly prefer b over a
Preferences II
- We will allow three possible answers:
a≻b: Strictly prefer a over b
a≺b: Strictly prefer b over a
a∼b: Indifferent between a and b
Preferences II
- We will allow three possible answers:
a≻b: Strictly prefer a over b
a≺b: Strictly prefer b over a
a∼b: Indifferent between a and b
- Preferences are a list of all such comparisons between all bundles
Assumptions About Preferences
- We assume preferences are "well-behaved" to model:
Assumptions About Preferences
- We assume preferences are "well-behaved" to model:
- Reflexivity : any bundle is at least as preferred as itself
Assumptions About Preferences
- We assume preferences are "well-behaved" to model:
Reflexivity : any bundle is at least as preferred as itself
Completeness : any two bundles can be compared
Assumptions About Preferences
- We assume preferences are "well-behaved" to model:
Reflexivity : any bundle is at least as preferred as itself
Completeness : any two bundles can be compared
Transitivity : rankings are logically consistent:
- If a≻b and b≻c, then a≻c
Assumptions About Preferences
Are these good assumptions?
Typical in economics: very often yes, sometimes no!
See Behavioral economics for interesting anomalies and exceptions

Mapping Preferences Graphically I
For each bundle, we now have 3 pieces of information:
- amount of x
- amount of y
- preference compared to other bundles
How to represent this information graphically?
Mapping Preferences Graphically II
Cartographers have the answer for us
On a map, contour lines link areas of equal height
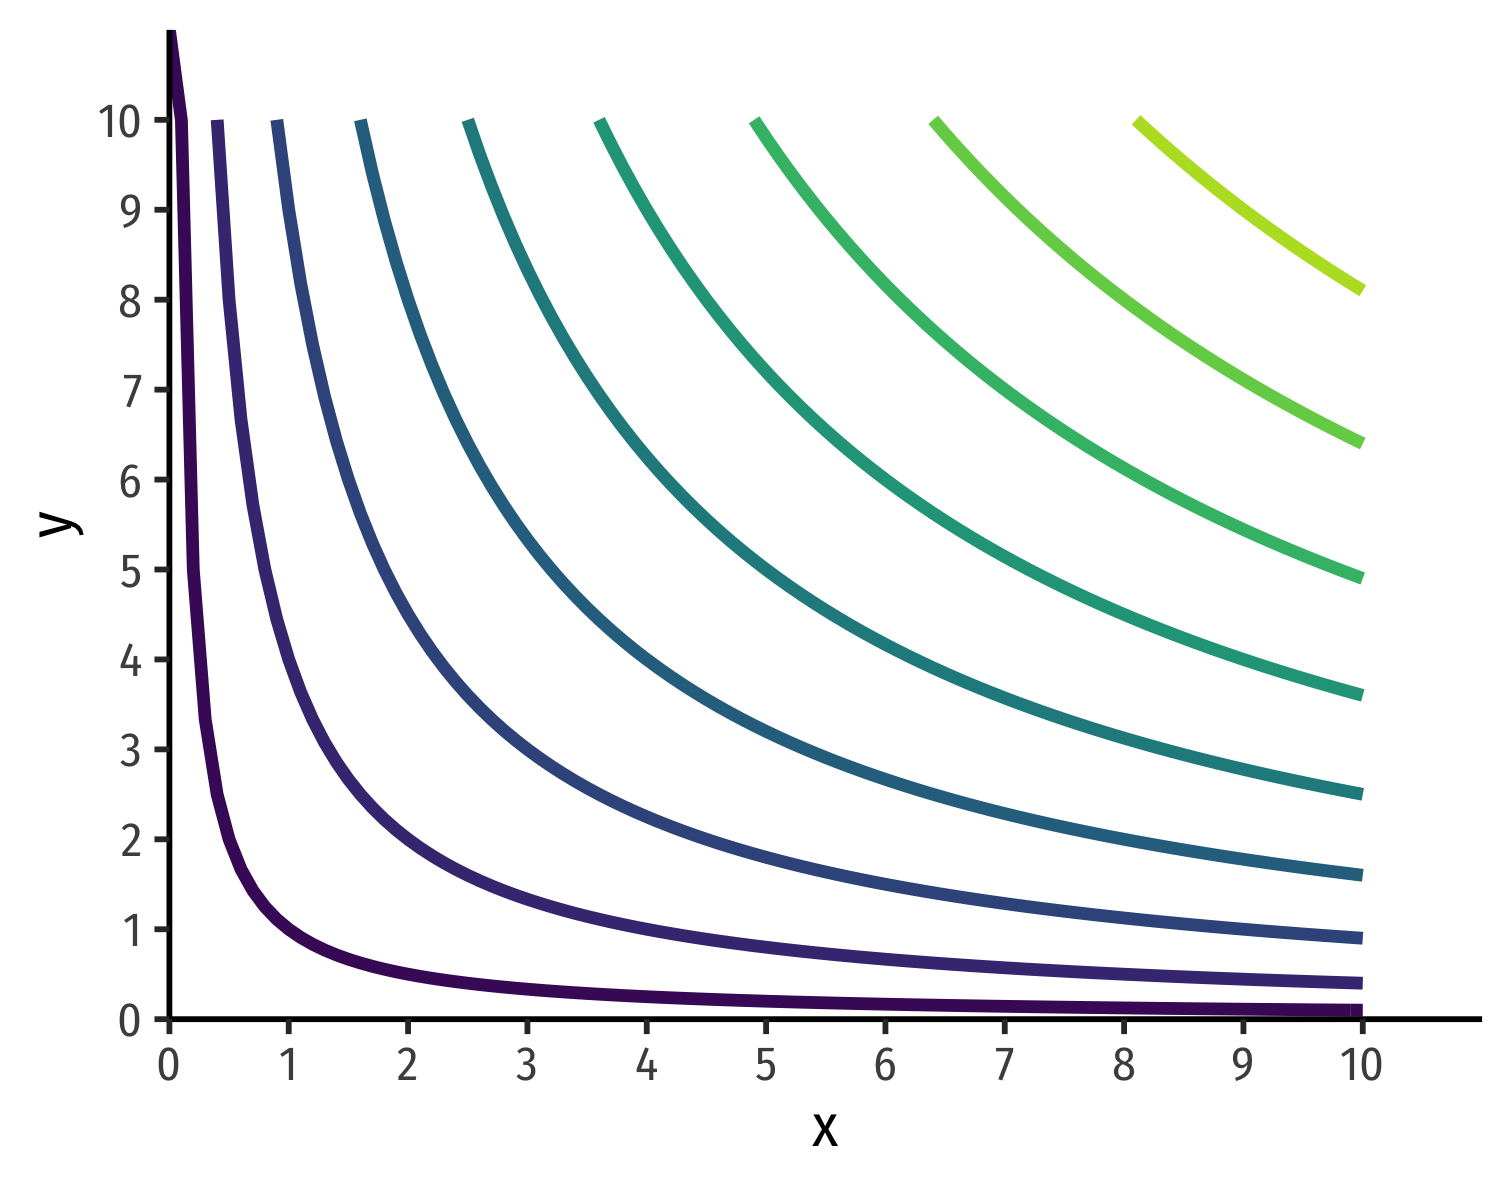
We will use "indifference curves" to link bundles of equal preference

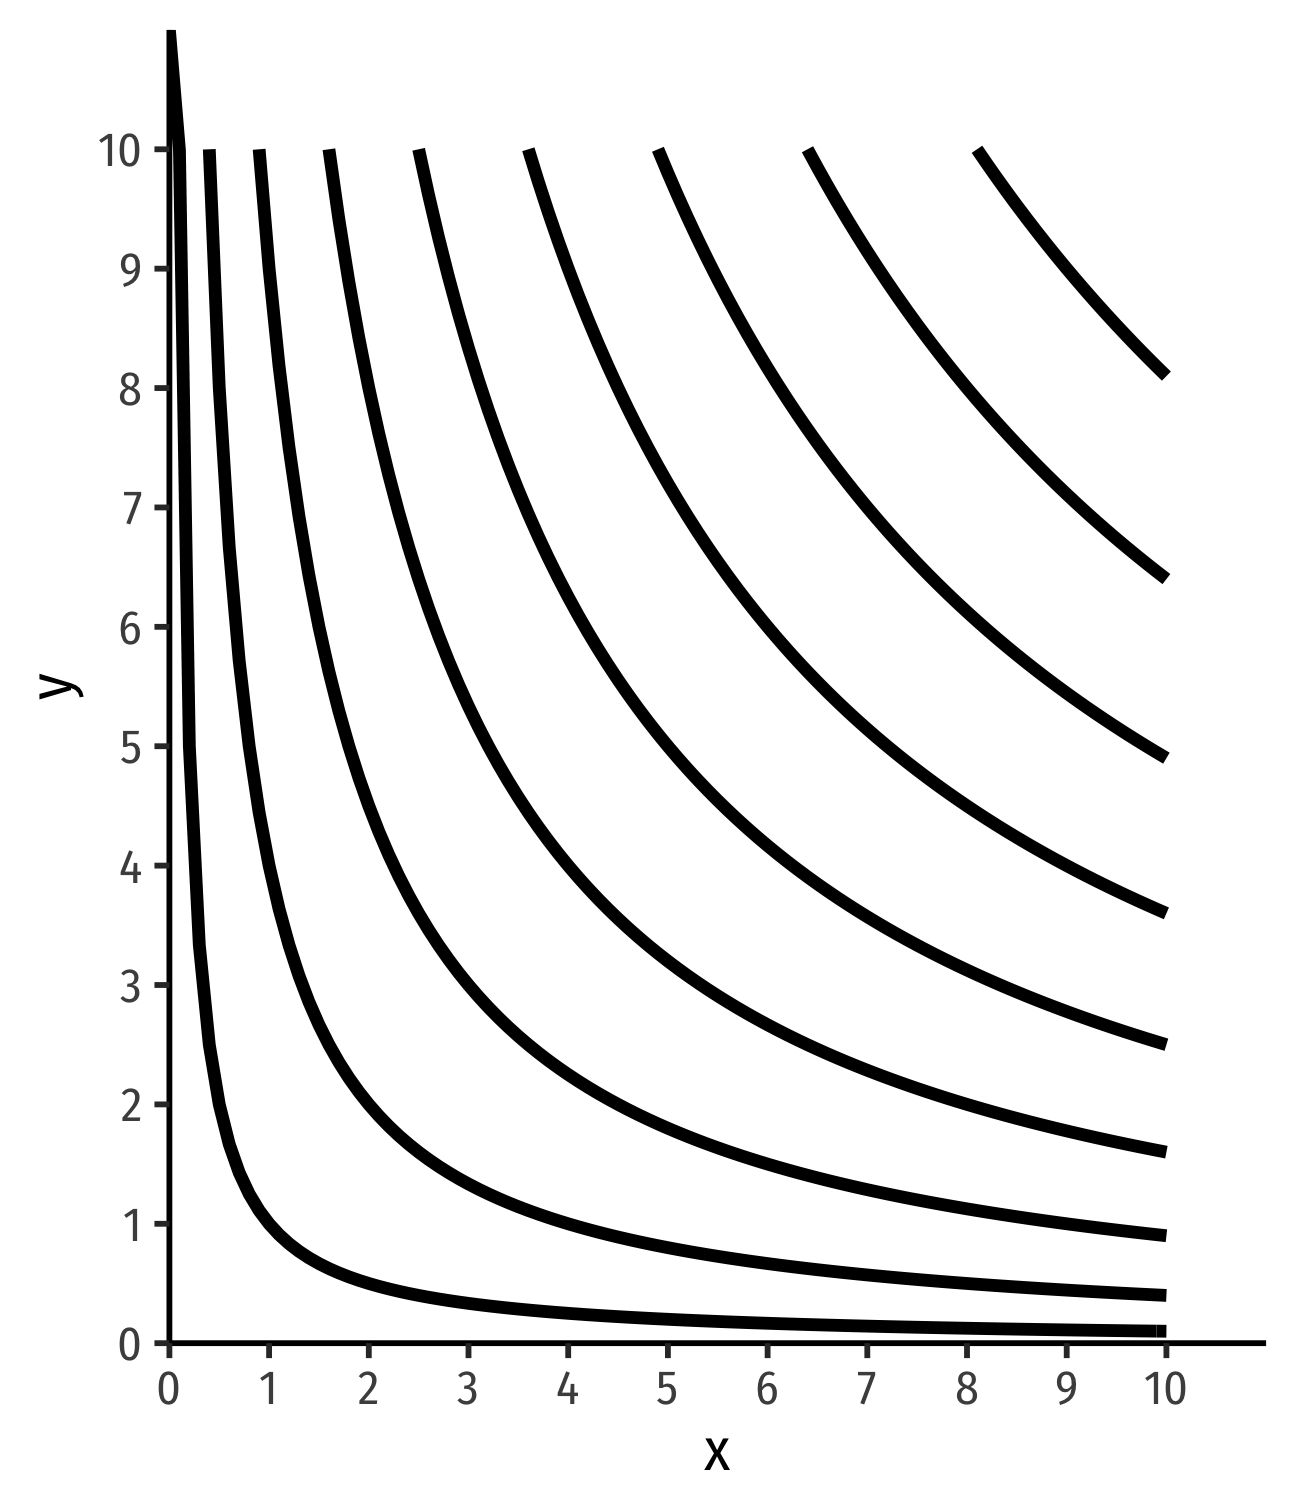
Mapping Preferences Graphically III
3-D "Mount Utility"
2-D Indifference Curve Contours
Indifference Curves: Example
Example: Suppose you are hunting for an apartment. You value both the size of the apartment and the number of friends that live nearby.
Indifference Curves: Example
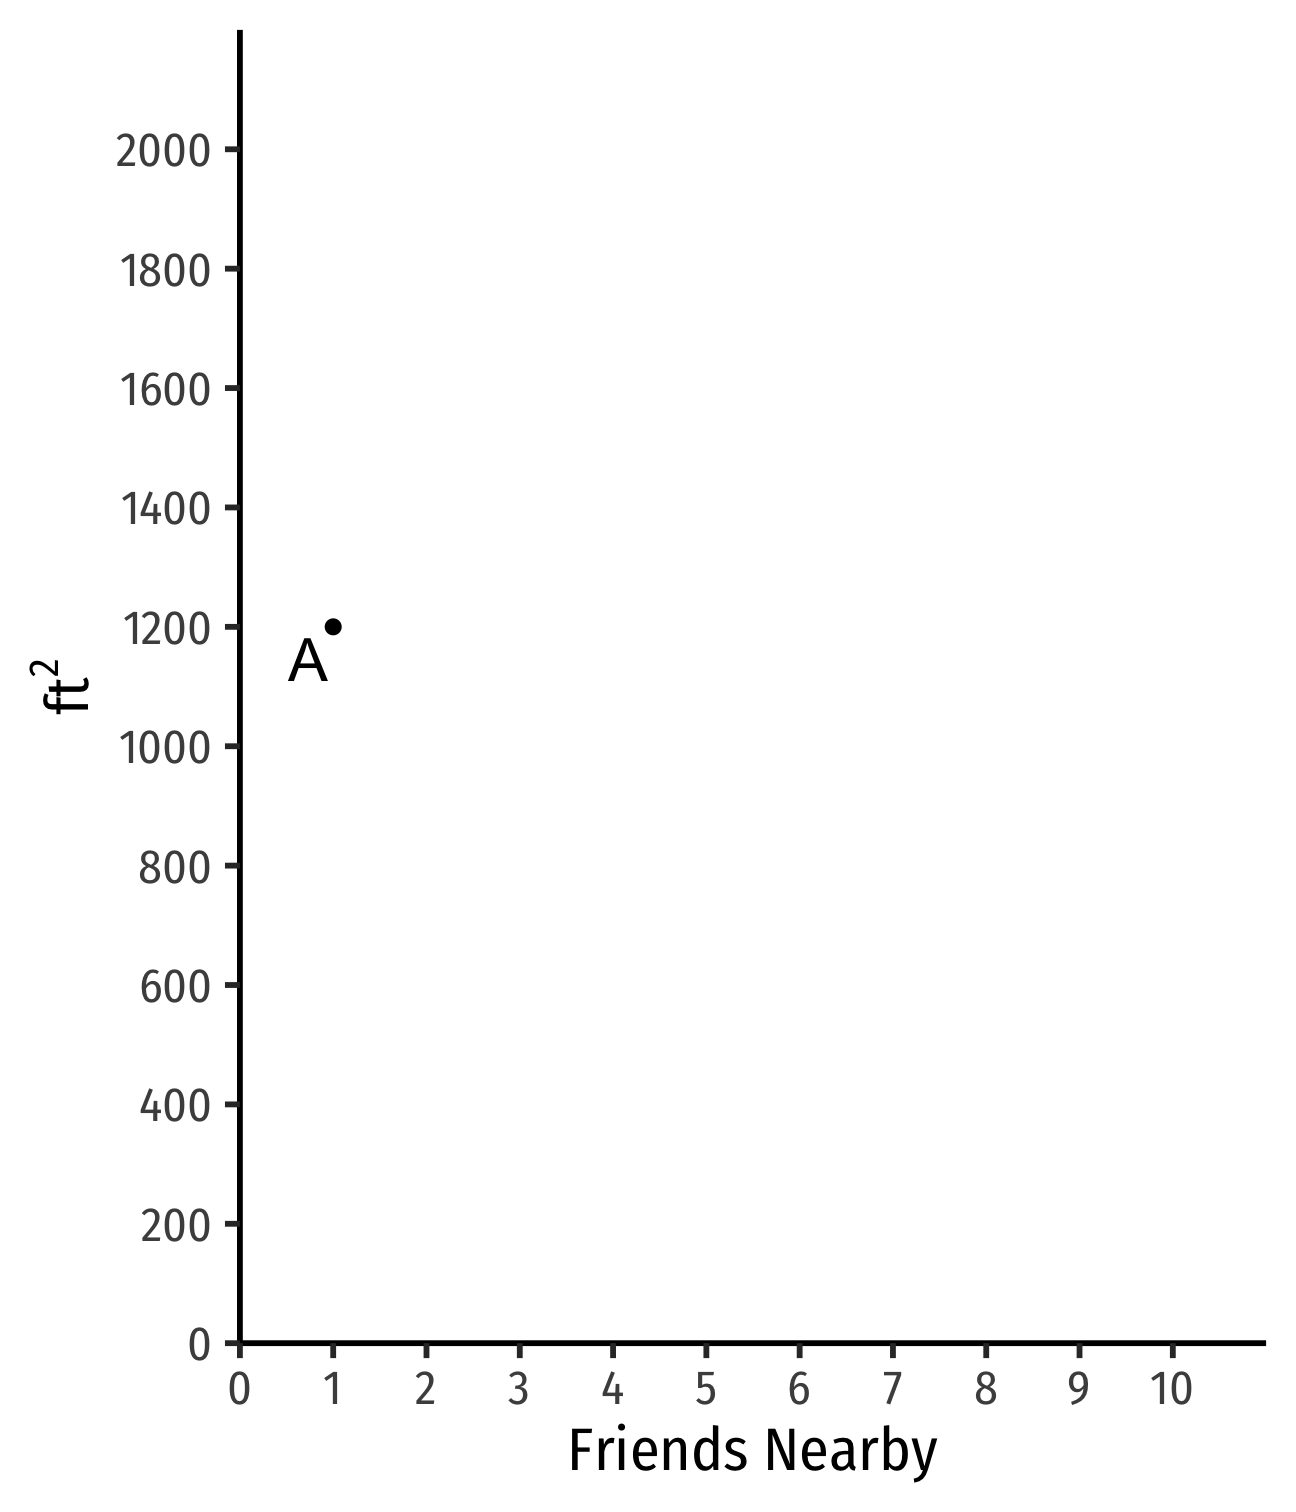
Example: Suppose you are hunting for an apartment. You value both the size of the apartment and the number of friends that live nearby.
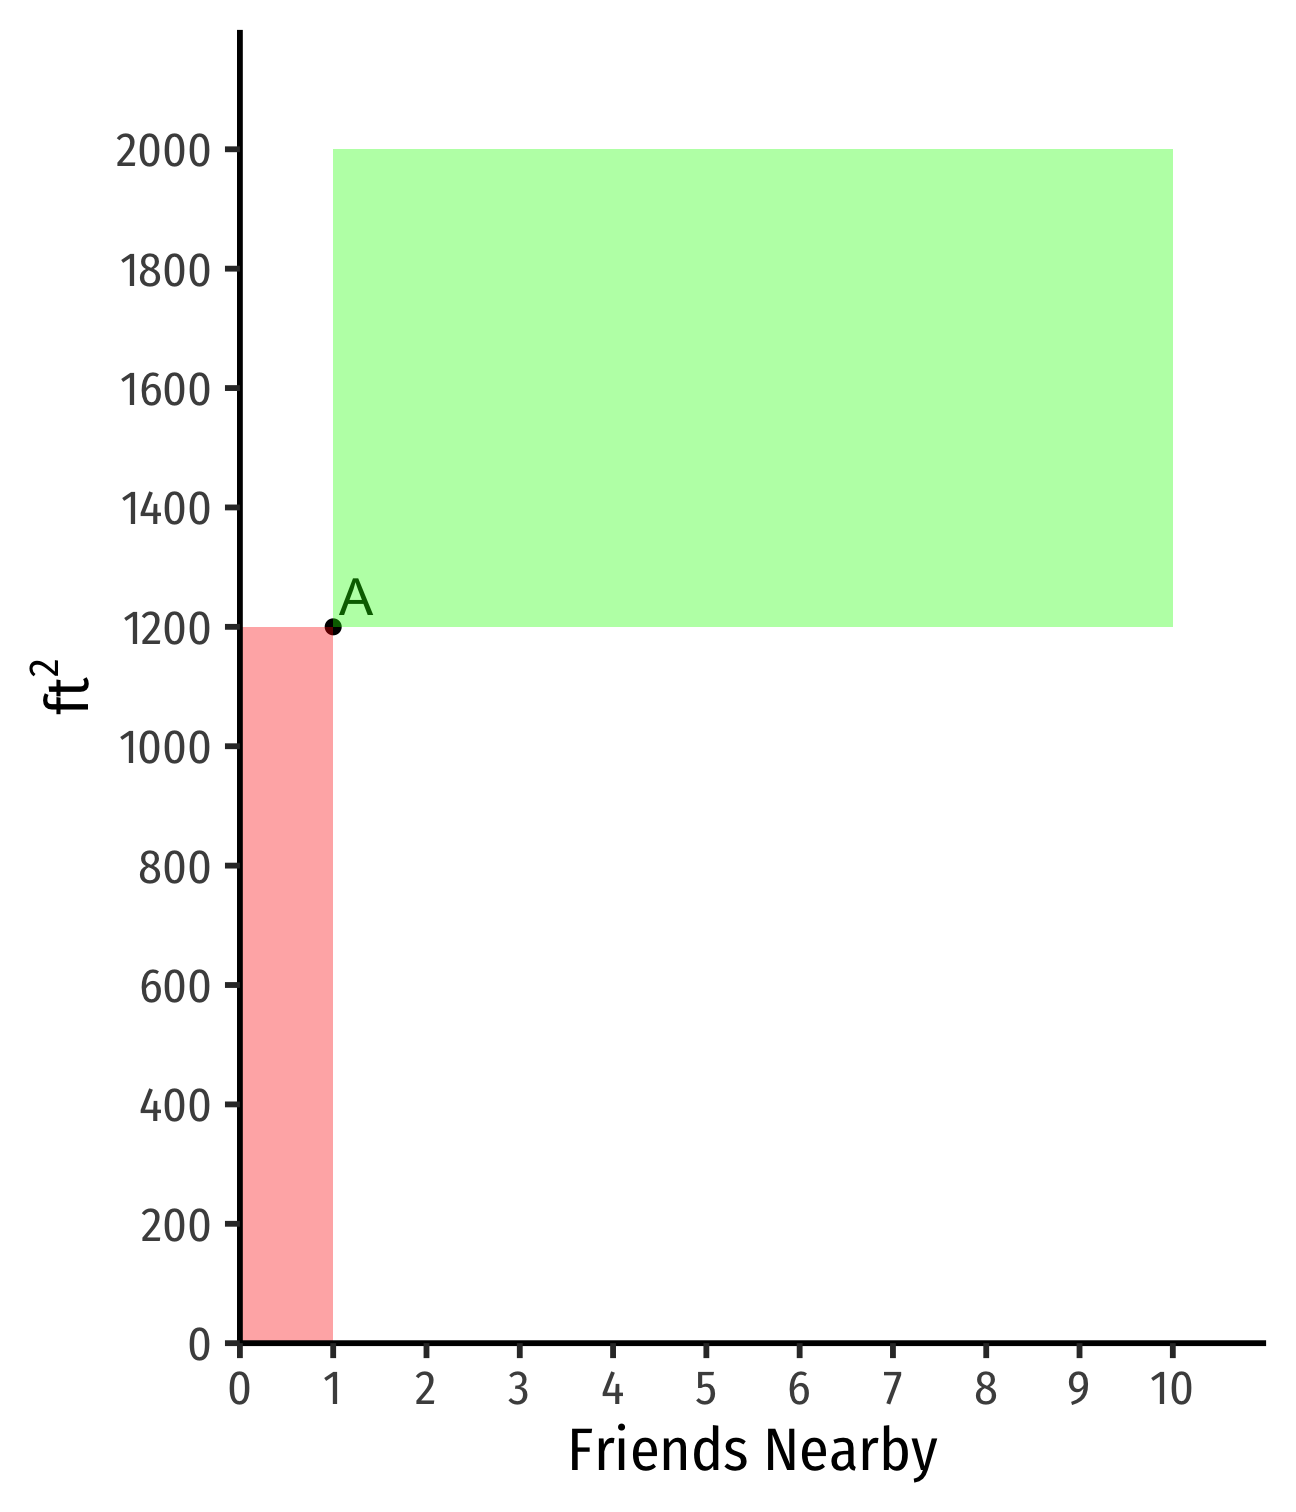
- Apt. A has 1 friend nearby and is 1,200 ft2
Indifference Curves: Example
Example: Suppose you are hunting for an apartment. You value both the size of the apartment and the number of friends that live nearby.
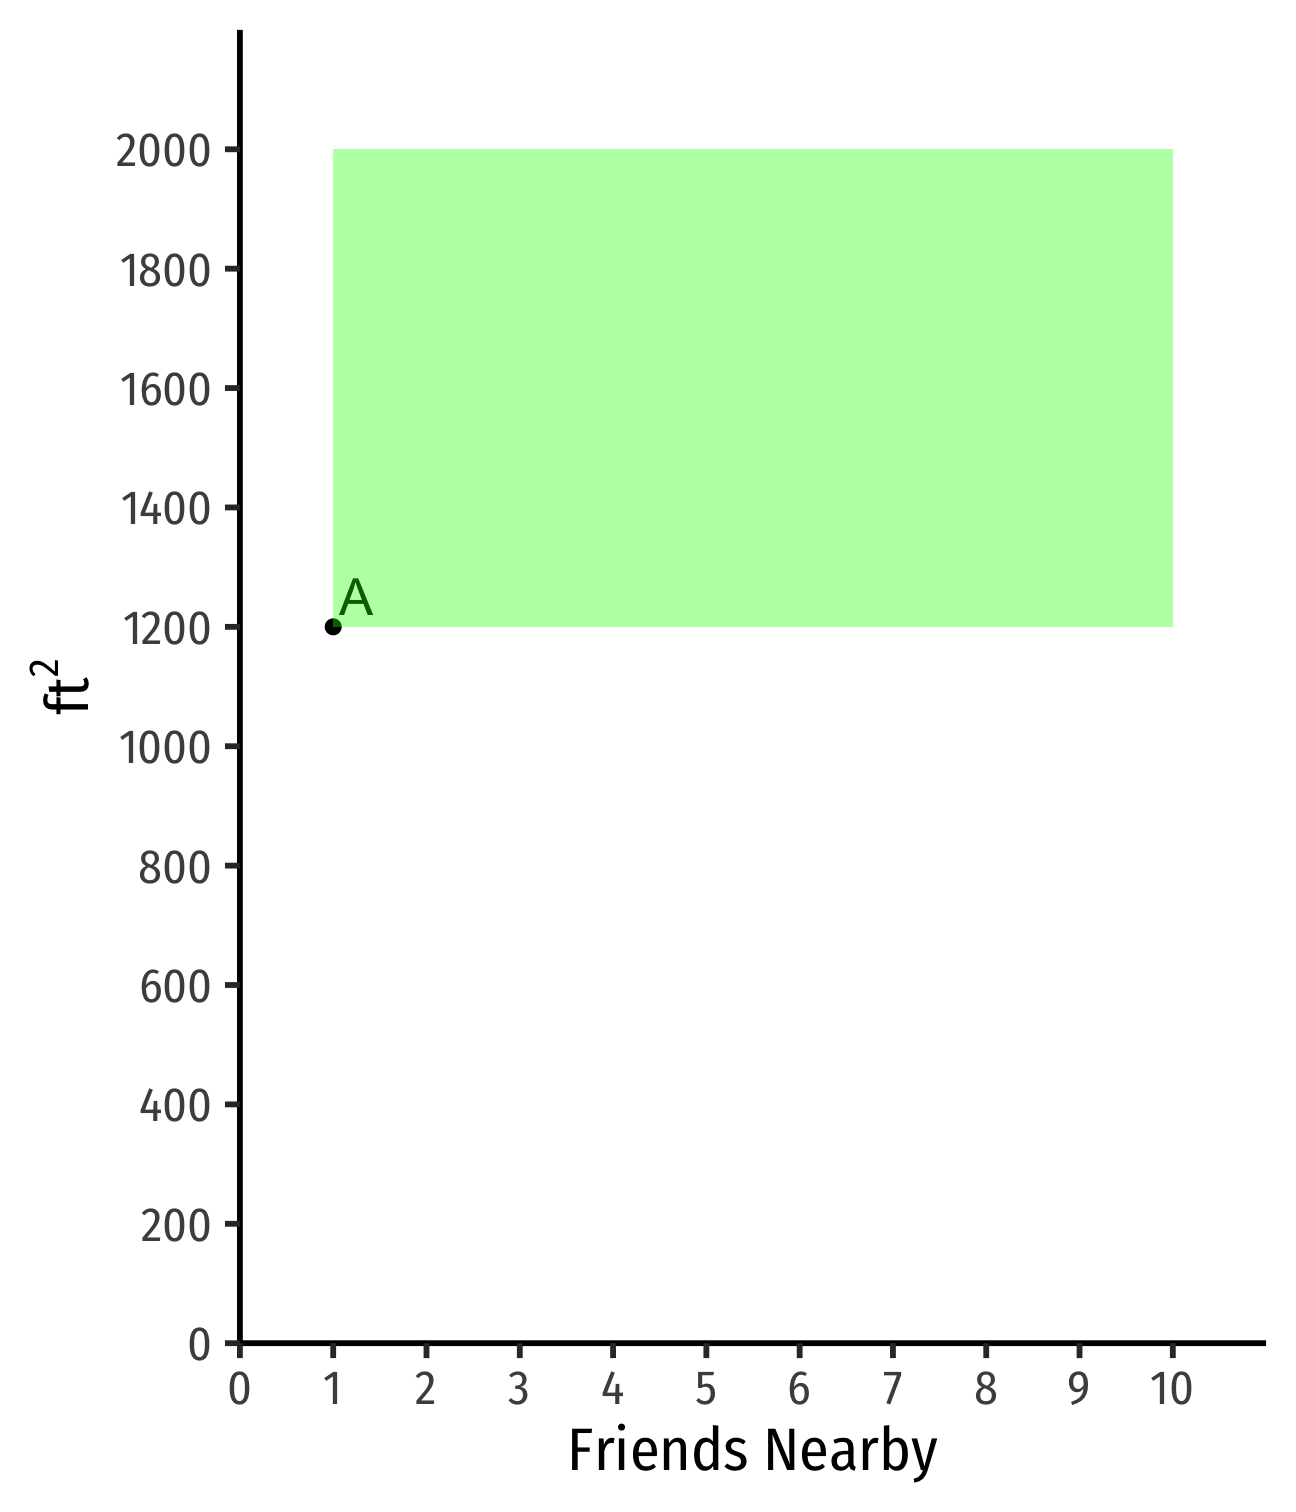
- Apt. A has 1 friend nearby and is 1,200 ft2
- Apartments that are larger and/or have more friends ≻A
Indifference Curves: Example
Example: Suppose you are hunting for an apartment. You value both the size of the apartment and the number of friends that live nearby.
- Apt. A has 1 friend nearby and is 1,200 ft2
- Apartments that are larger and/or have more friends ≻A
- Apartments that are smaller and/or have fewer friends ≺A
Indifference Curves: Example
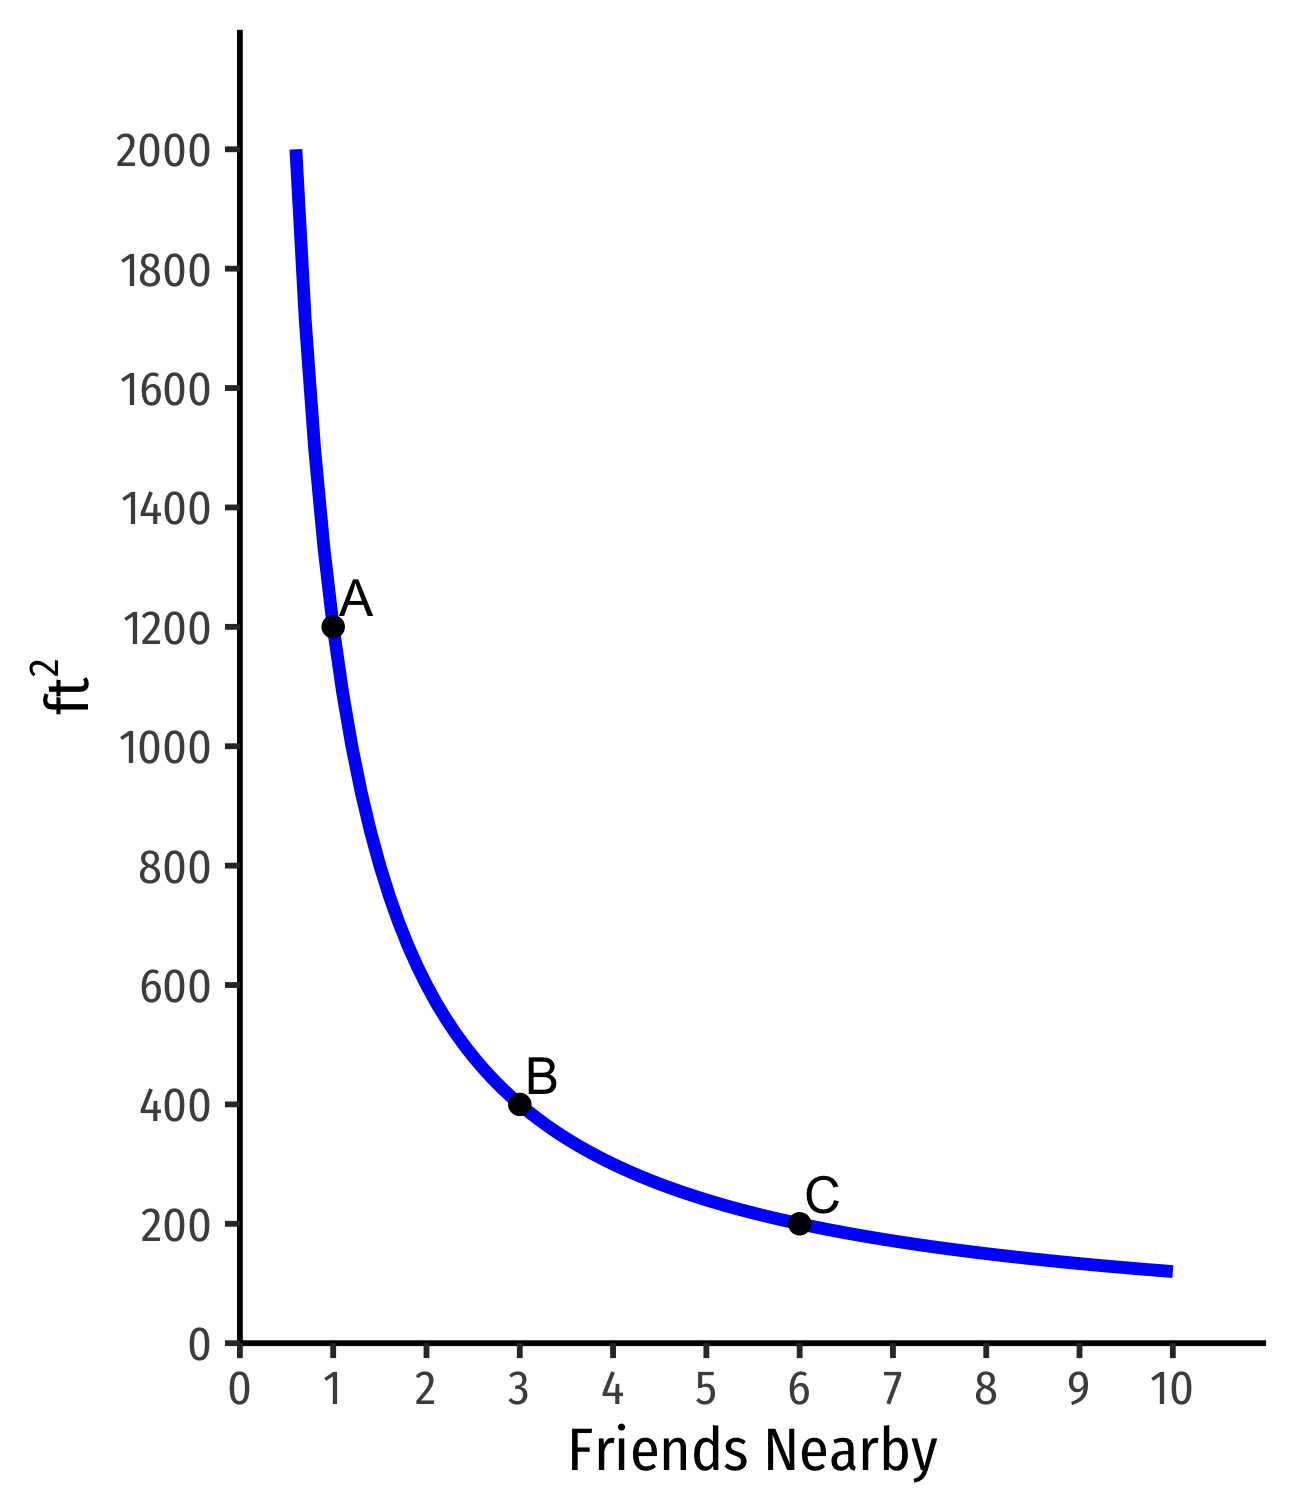
Example:
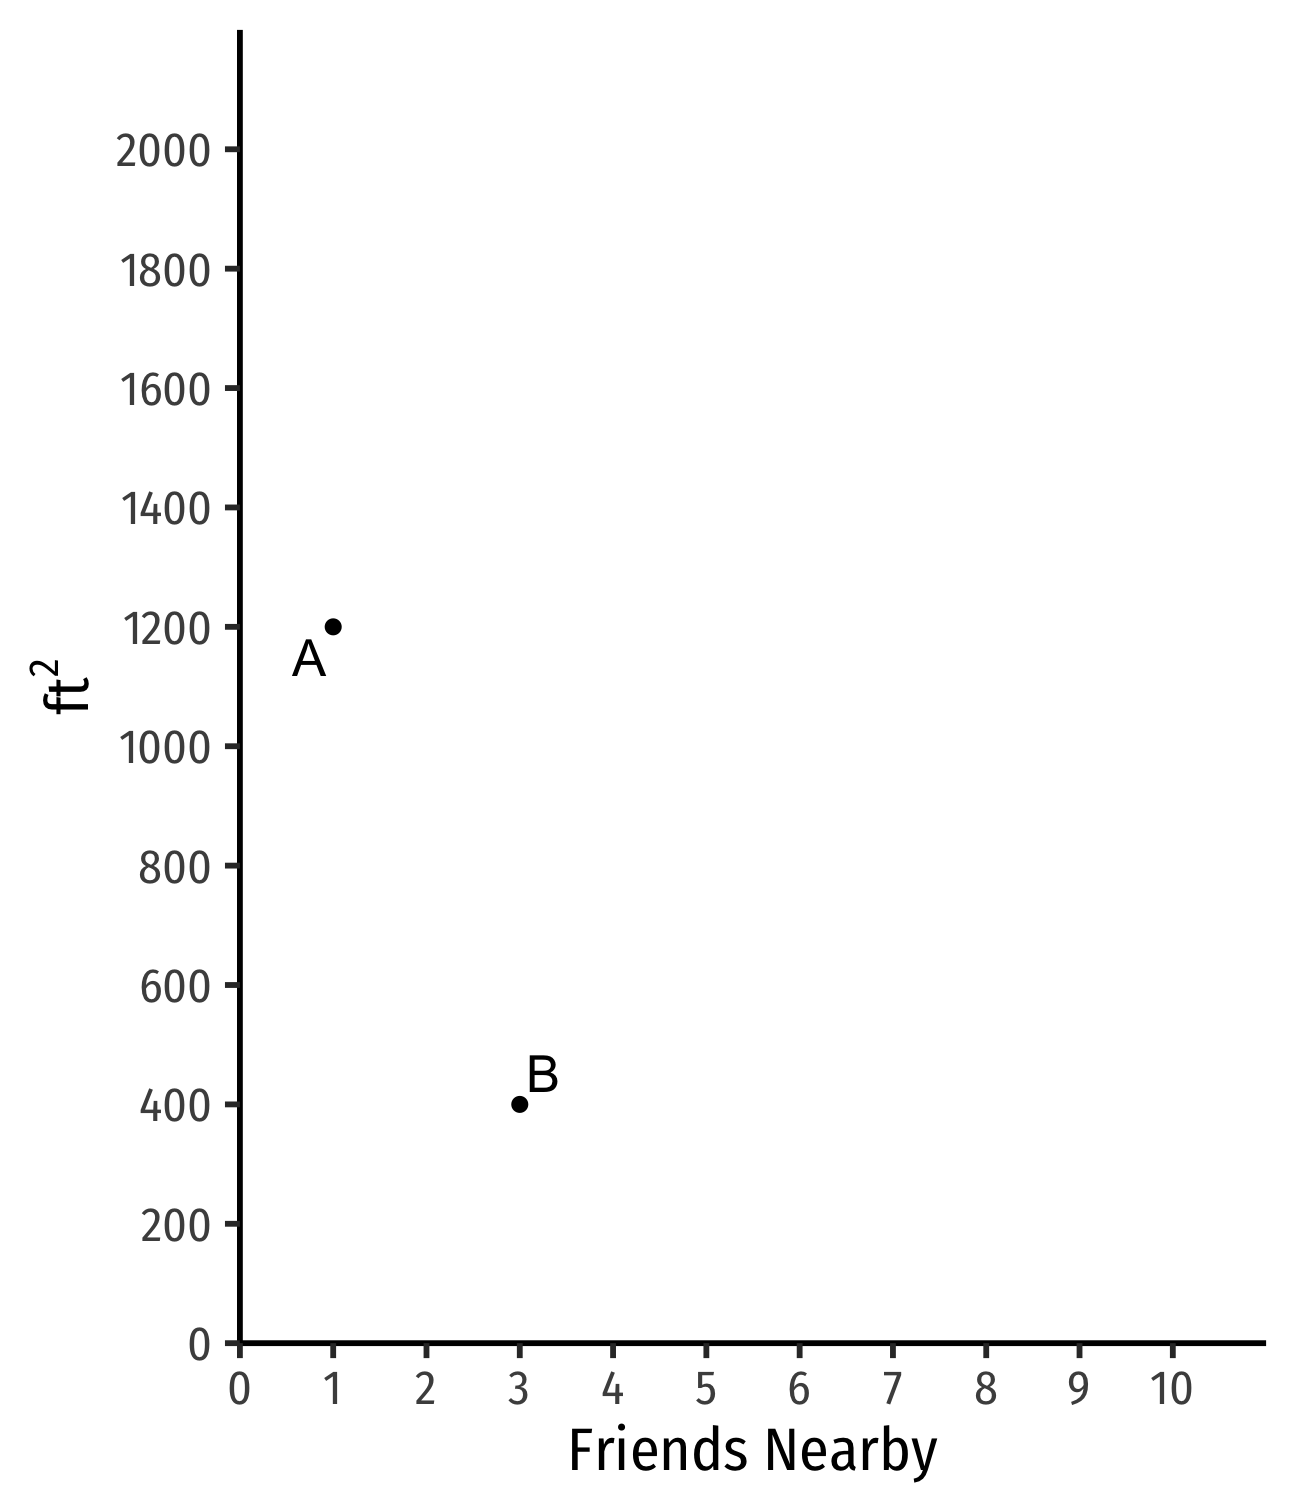
Apt. A has 1 friend nearby and is 1,200 ft2
Apt. B has more friends but less ft2
Indifference Curves: Example
Example:
Apt. A has 1 friend nearby and is 1,200 ft2
Apt. B has more friends but less ft2
Apt. C has still more friends but less ft2
Indifference Curves: Example
Example:
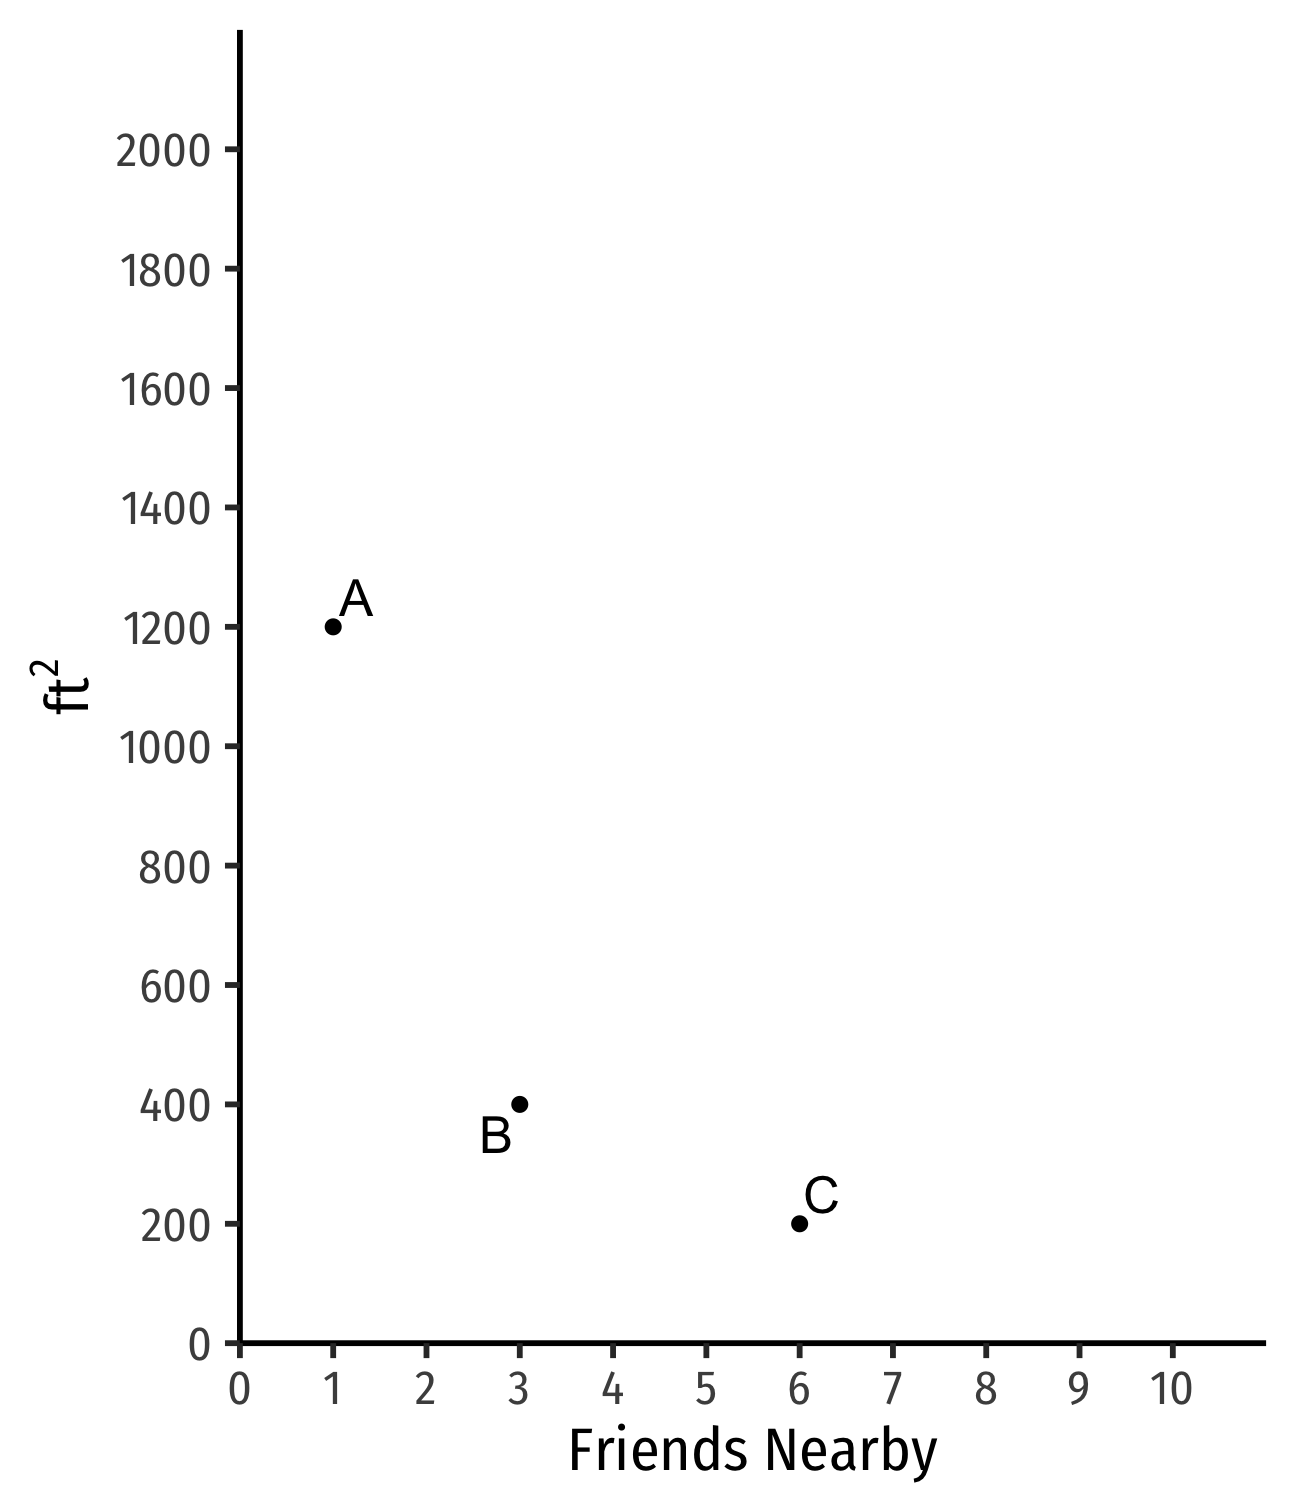
Apt. A has 1 friend nearby and is 1,200 ft2
Apt. B has more friends but less ft2
Apt. C has still more friends but less ft2
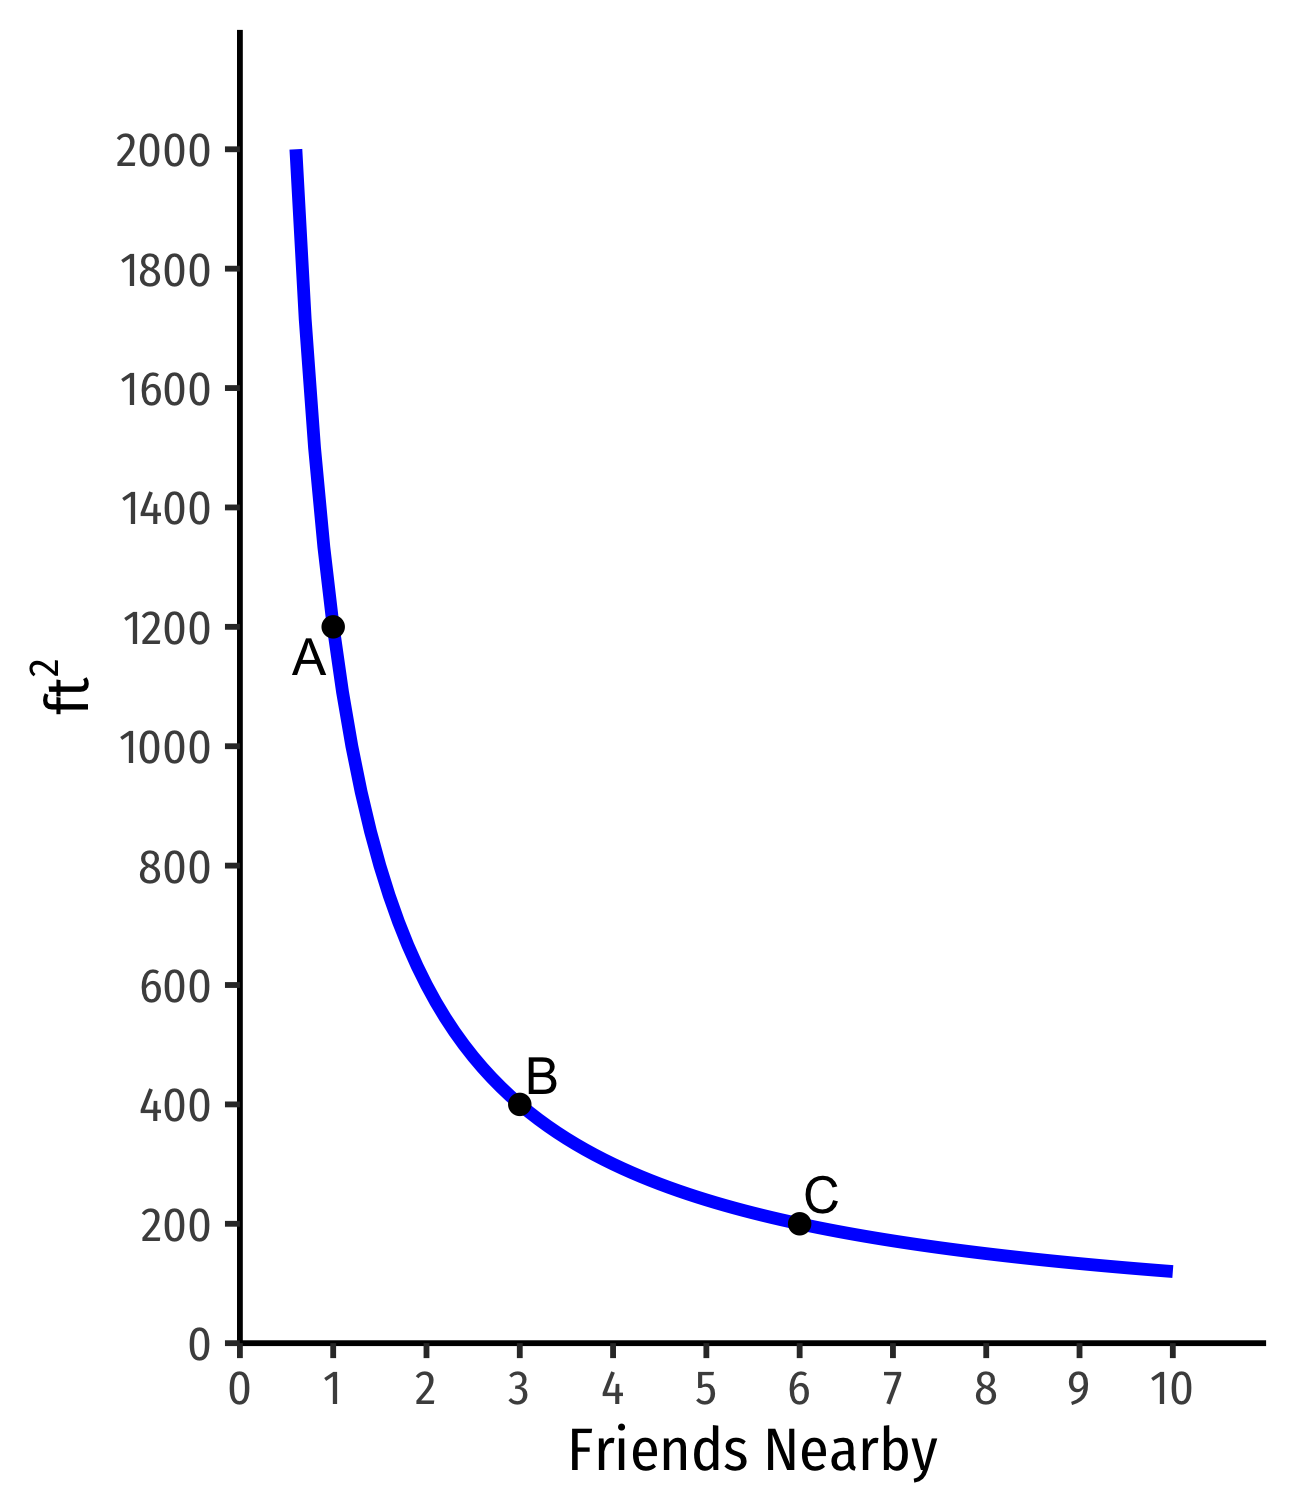
If A∼B∼C, on same indifference curve
Indifference Curves: Example
- Indifferent between all apartments on the same curve
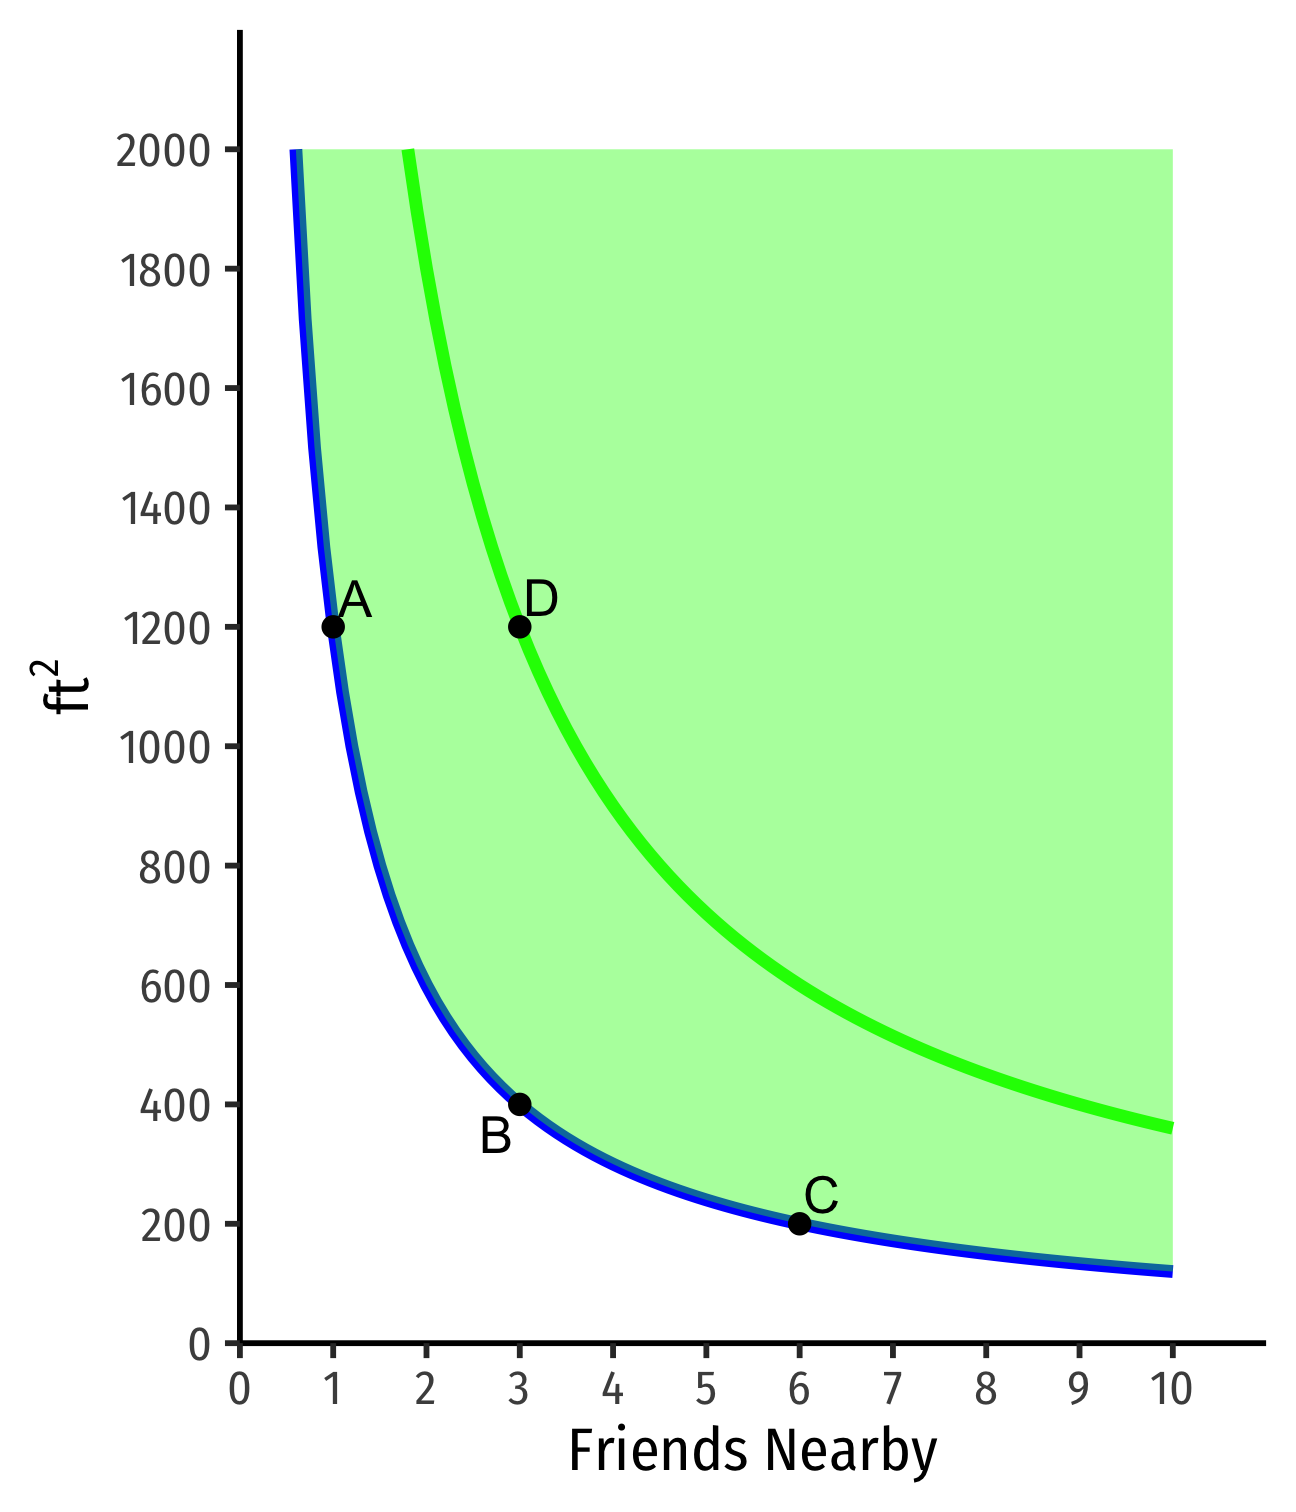
Indifference Curves: Example
Indifferent between all apartments on the same curve
Apts above curve are preferred over apts on curve
- D≻A∼B∼C
- On a higher curve
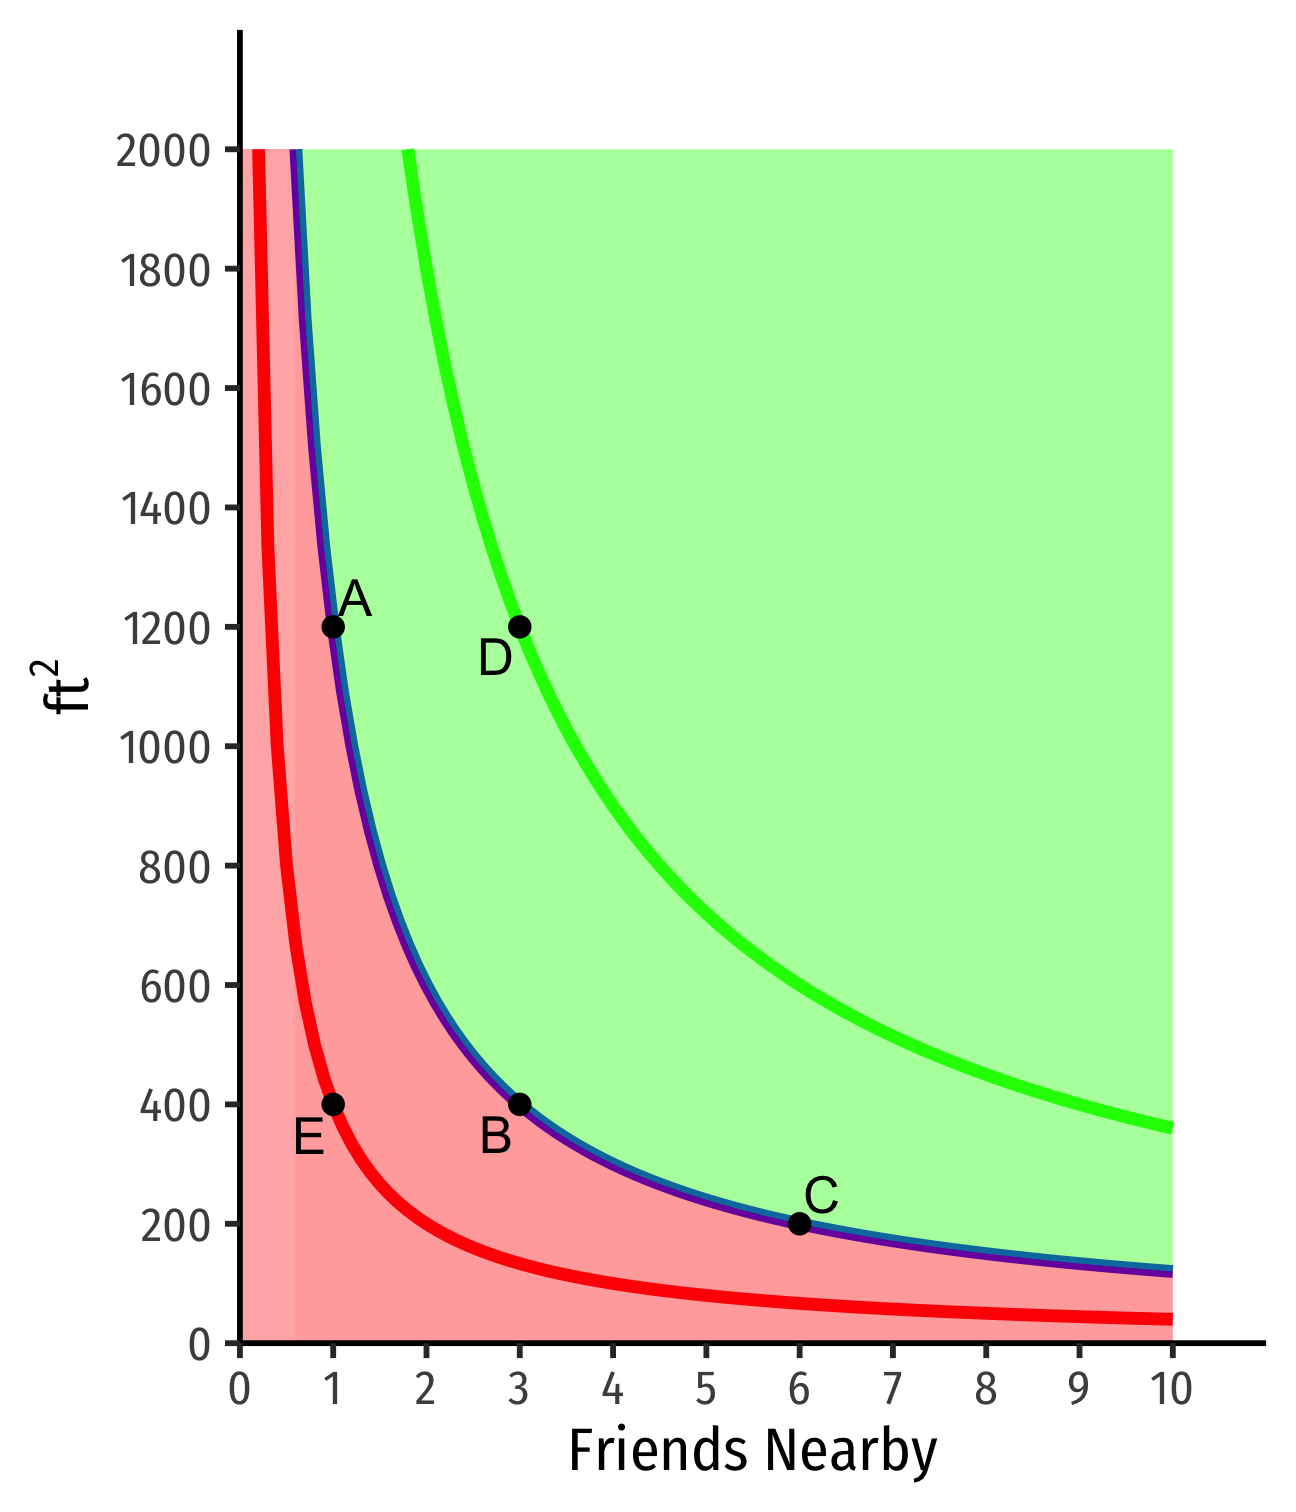
Indifference Curves: Example
Indifferent between all apartments on the same curve
Apts above curve are preferred over apts on curve
- D≻A∼B∼C
- On a higher curve
- Apts below curve are less preferred than apts on curve
- E≺A∼B∼C
- On a lower curve
Assumptions About Indifference Curves
- Like preferences, indifference curves are "well-behaved" when:
We can always draw indifference curves: two bundles can always be ranked
Monotonic: "more is preferred to less"
Convex: "averages are preferred to extremes"
Indifference curves can never cross: preferences are transitive
Assumption 1: We Can Always Draw Them
We can always draw indifference curves: two bundles can always be ranked
Every possible bundle (point on graph) is on an indifference curve
Assumption 1: We Can Always Draw Them
We can always draw indifference curves: two bundles can always be ranked
Every possible bundle (point on graph) is on an indifference curve
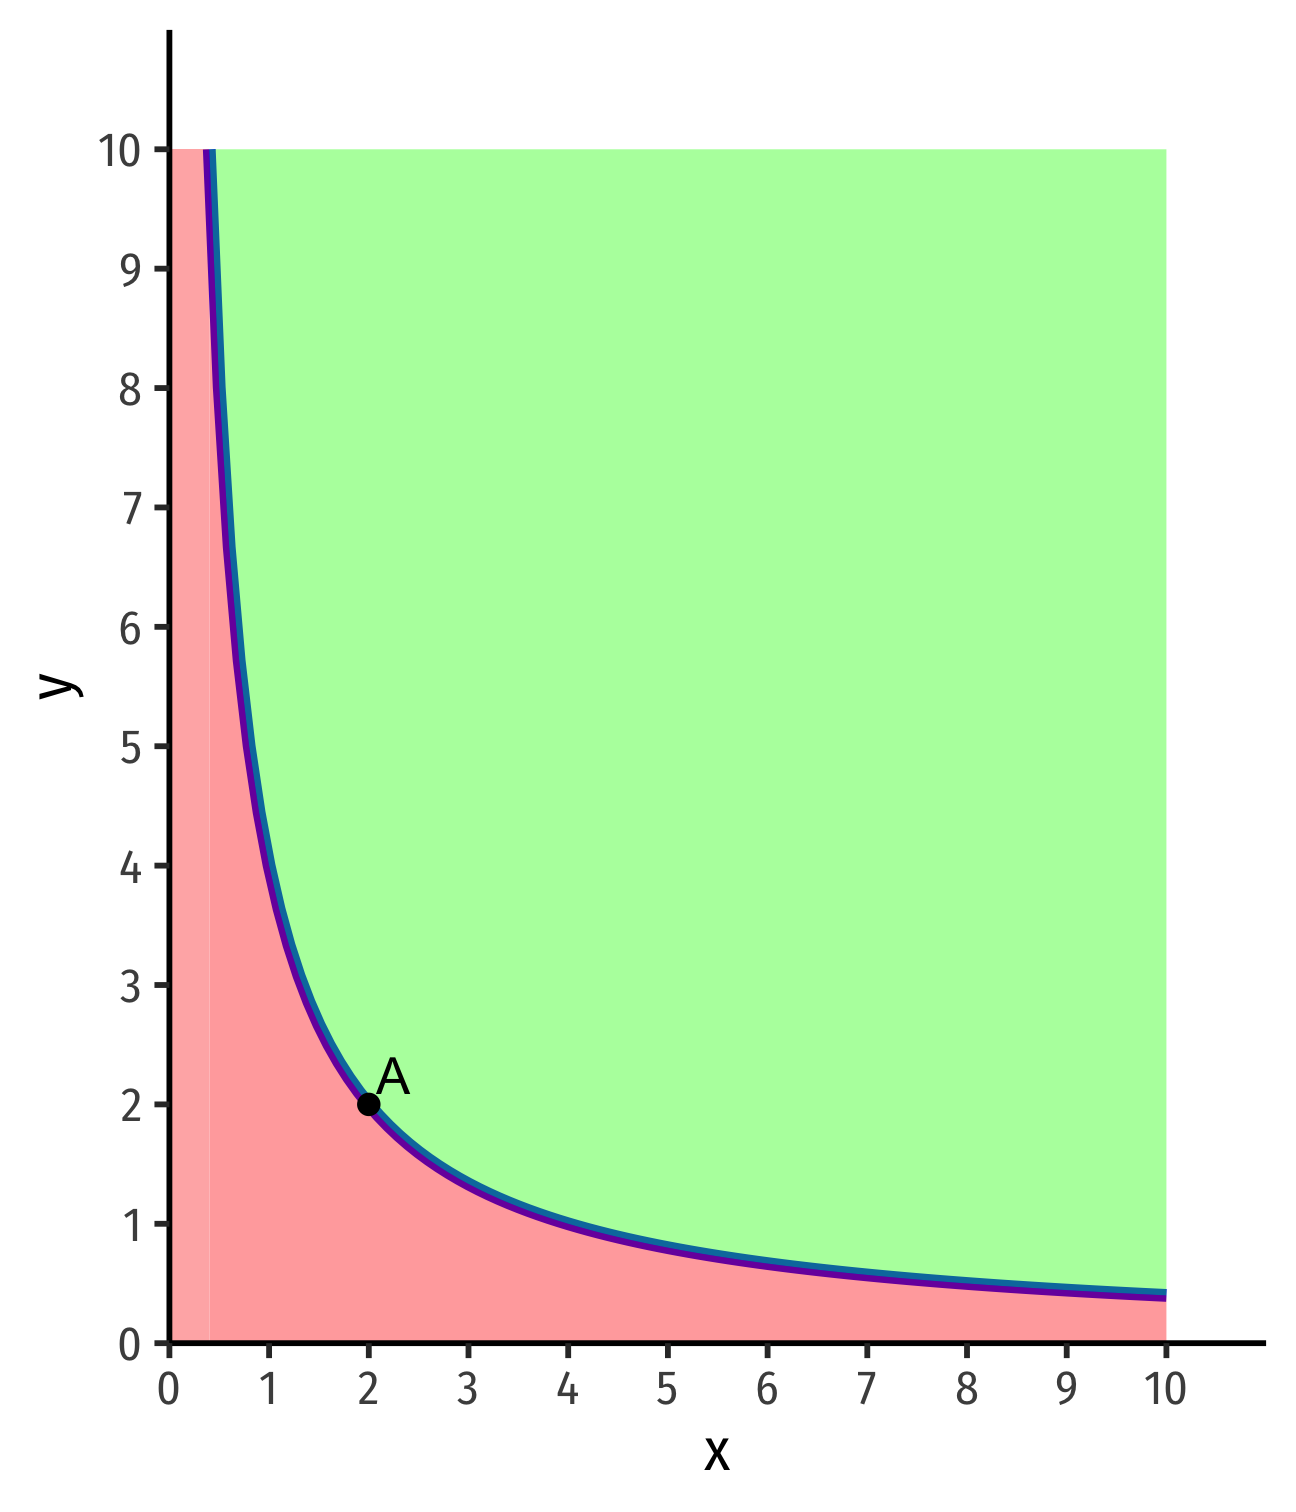
Assumption 2: Monotonicity
Monotonic: "more is preferred to less"
For any bundle b with more of at least one good than bundle a⟹a≺b
Moves to NE always preferable
Moves to SW always unpreferable
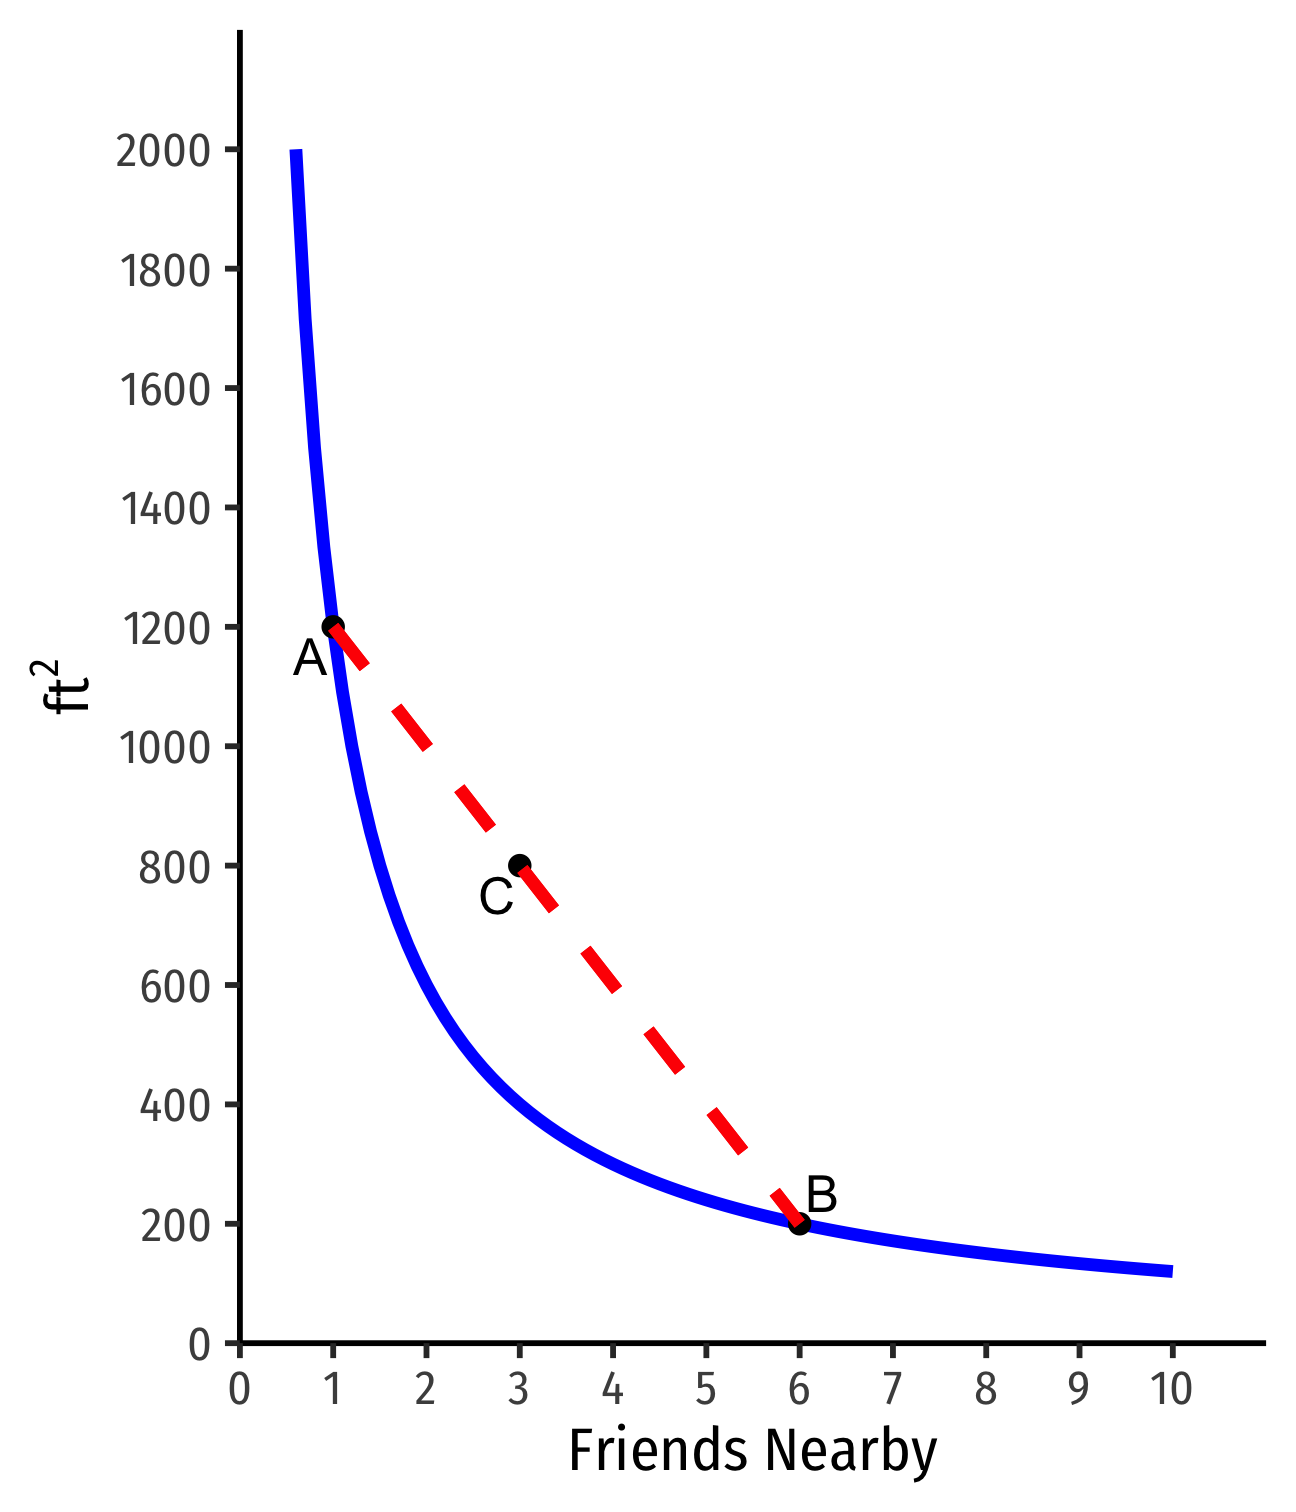
Assumption 3: Convexity
Convex: "averages are preferred to extremes"
Take a (weighted) average of any two apartments on curve
Any "good balance" of the two goods (e.g. C)≻ "unbalanced" (A or B)
People prefer variety in consumption
Math: convex function ⟹ line connecting 2 points lies above function
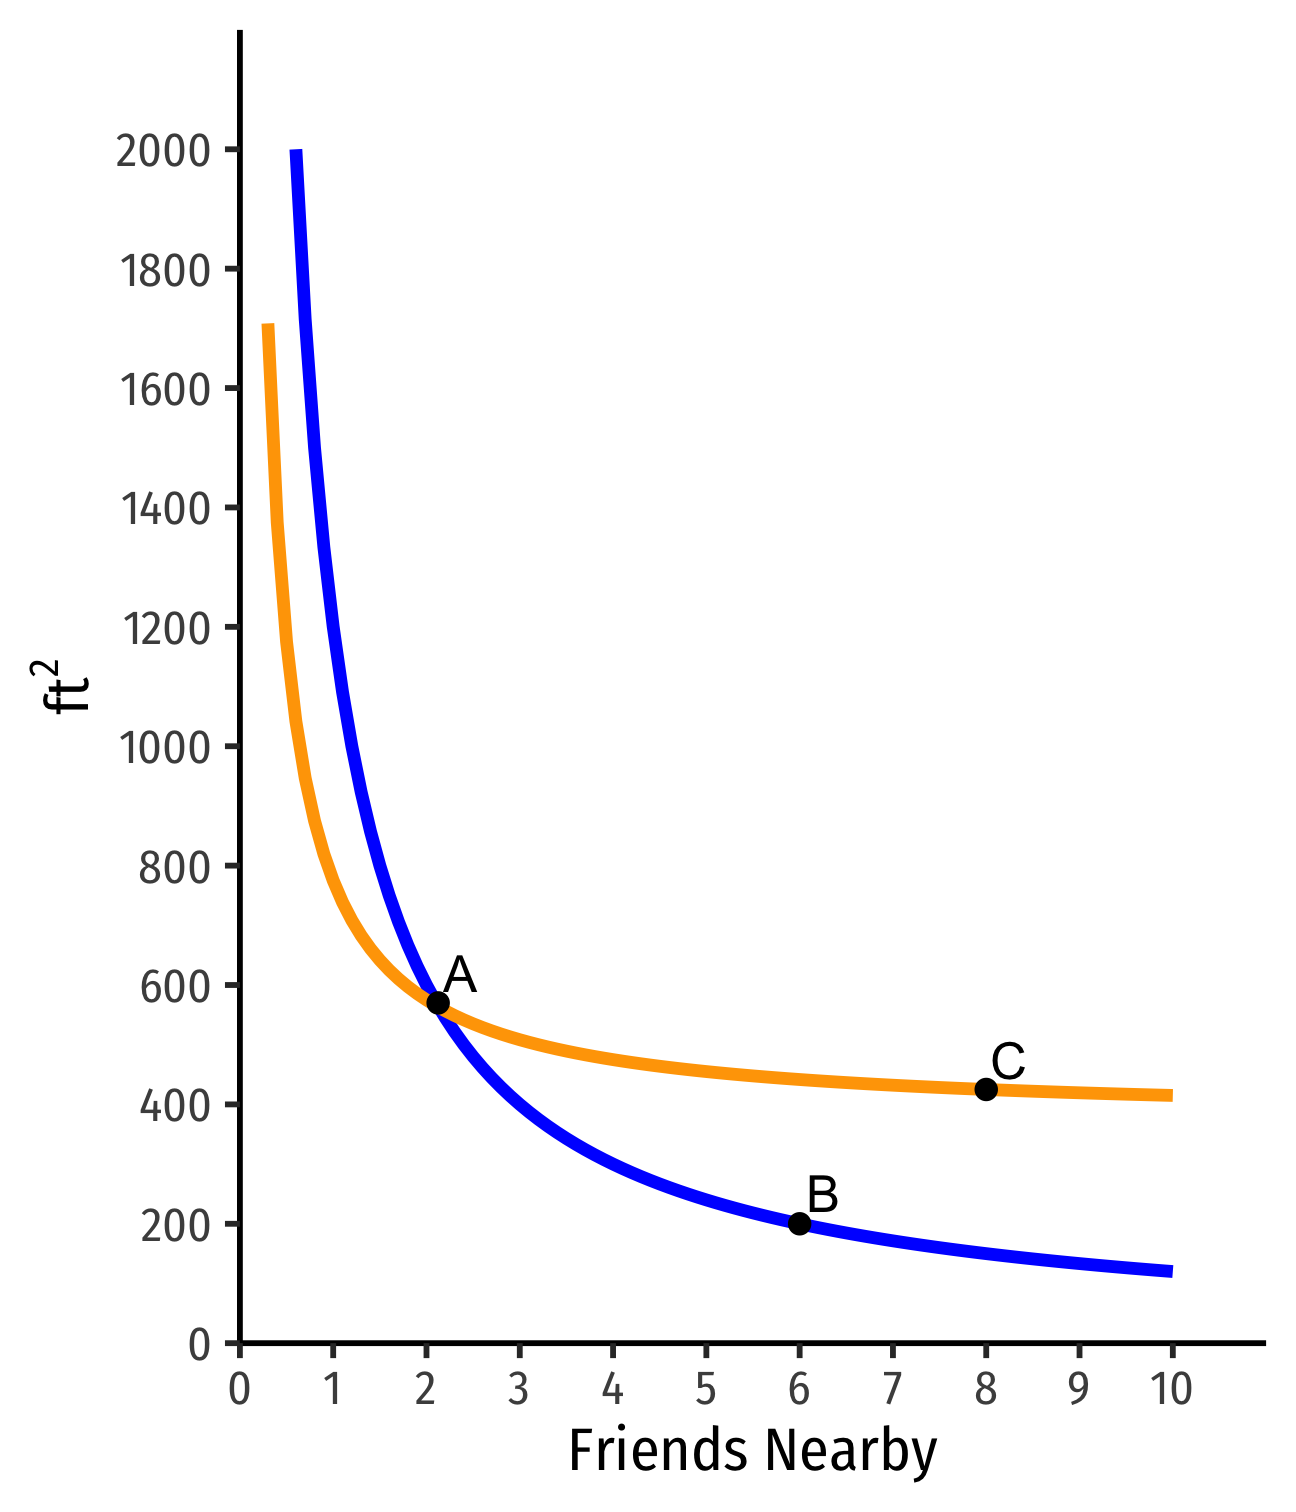
Assumption 4: Curves Never Cross
Indifference curves can never cross: preferences are transitive
Suppose two curves crossed:
- A∼B
- B∼C
- But C ≻ B!
- Preferences are not transitive!
Marginal Rate of Substitution I
- If I take away one friend nearby, how many more ft2 would you need to keep you indifferent?

Marginal Rate of Substitution I
If I take away one friend nearby, how many more ft2 would you need to keep you indifferent?
Marginal Rate of Substitution (MRS): rate at which you trade off one good for the other and remain indifferent
Think of this as your opportunity cost: # of units of y you need to give up to acquire 1 more x
Marginal Rate of Substitution vs. Budget Constraint Slope
Budget constraint (slope) measured the market's tradeoff between x and y based on market prices
MRS measures your personal evaluation of x vs. y based on your preferences
Foreshadowing: what if they are different? Are you truly maximizing your preferences?
Marginal Rate of Substitution II
MRS is the slope of the indifference curve MRSx,y=−ΔyΔx=riserun
Amount of y given up for 1 more x
Note: slope (MRS) changes along the curve!

So Where are the Numbers?
Long ago (1890s), utility considered a real, measurable, cardinal scale†
Utility thought to be lurking in people's brains
- Could be understood from first principles: calories, water, warmth, etc
Obvious problems

† "Neuroeconomics" & cognitive scientists are re-attempting a scientific approach to measure utility
Utility Functions?
20th century innovation: preferences as the objects of maximization
We can plausibly measure preferences via implications of peoples' actions!
Principle of Revealed Preference: if x and y are both feasible, and if x is chosen over y, then the person must (weakly) prefer x⪰y
Flawless? Of course not. But extremely useful!
Utility Functions! I
So how can we build a function to "maximize preferences"?
Construct a utility function u(⋅)† that represents preference relations (≻,≺,∼)
Assign utility numbers to bundles, such that, for any bundles a and b: a≻b⟺u(a)>u(b)
† The ⋅ is a placeholder for whatever goods we are considering (e.g. x, y, burritos, lattes, etc)
Utility Functions! II
We can model "as if" the consumer is maximizing utility/preferences by maximizing the utility function:
"Maximizing preferences": choosing a such that a≻b for all available b
"Maximizing utility": choosing a such that u(a)>u(b) for all available b
Identical if they contain the same information
Utility Functions, Pural III
Utility numbers have an ordinal meaning only, not cardinal
- Only the ordering c≻b≻a matters!
Both are valid:†
- u(c)>u(b)>u(a)
- v(c)>v(b)>v(a)
† See the Mathematical Appendix in Today's Class Page for why.